
Data Analysis
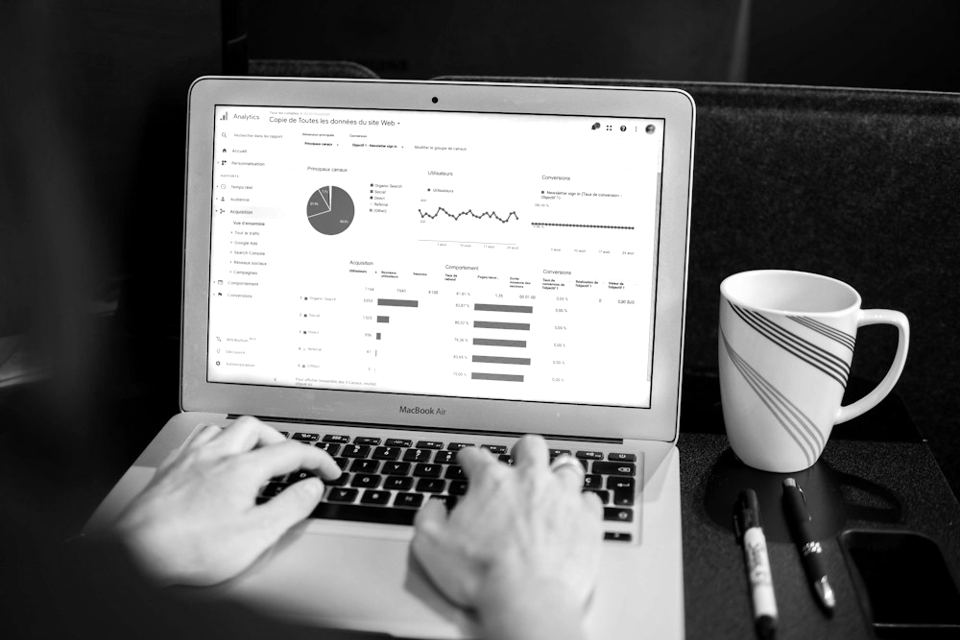
Deep-dive analytical work that transforms raw datasets into clear, actionable intelligence. We model, clean, and interpret your data at any scale.
Business intelligence and data analytics, principal-led.
Jade Logic builds Power BI and Tableau dashboards, data pipelines, and reporting for executives, regulators, and public agencies. We also build websites, online booking, and AI assistants for Cincinnati small businesses.
Jade Logic was founded to close the gap between powerful analytics tools and the organizations that need them most. The firm is principal-led: the senior consultant who scopes your project is the one who builds it, drawing on experience in regulatory reporting, fintech, and healthcare supply chain analytics.
Jade Logic doesn't hand off deliverables and disappear. Each engagement builds your team's capability so the work keeps paying off after the project ends.
Principal's experience includes Citi, FIS, Bon Secours Mercy Health, and Aimpoint Digital.
Work performed by Jade Logic's principal in prior roles.
Numbers live in three systems and a few spreadsheets. Each team defines them a little differently. By the time someone reconciles them, the meeting has moved on.
Jade Logic closes that gap from both ends: clean, governed data underneath, and dashboards built around the decisions your leaders actually make.
Finance, operations, and the dashboard each show a different number, and the discussion turns into which one is right.
Analysts pull the same extracts and rebuild the same report each month instead of answering new questions.
Dashboards get built to spec, then go unused because people don't trust them or don't know how to use them.
Business intelligence and analytics for data-driven organizations.
Deep-dive analytical work that transforms raw datasets into clear, actionable intelligence. We model, clean, and interpret your data at any scale.

Interactive dashboards built in Power BI and Tableau that communicate complex trends simply, designed for executives and operators alike.

Tailored workshop programs that upskill your analytics team, from introductory sessions to advanced Power BI and Alteryx mastery.

We help you build and mature an internal analytics CoE, establishing governance, standards, and a culture of data-driven decision making.

Access senior analytics expertise exactly when you need it: critical deadlines, one-off projects, or ongoing flex support on your timeline.
We engineer the data foundation on the platforms enterprises trust, so your numbers hold up.

From executive scorecards to operational dashboards, reports your team actually uses.

Interactive, story-driven visualizations that make complex data impossible to misread.

Automated pipelines and data preparation workflows that eliminate manual data wrangling for good.
Scalable data engineering and AI-ready pipelines built for teams that move fast.
From executive scorecards to operational dashboards, reports your team actually uses.

Deep domain knowledge across high-complexity sectors where analytics creates measurable competitive advantage.

State and local agencies, schools, and public authorities: audit-ready reporting, compliance analytics, and performance dashboards.
Banking, fintech, and capital markets: regulatory reporting, risk analytics, and compliance intelligence where accuracy is non-negotiable.
Clinical operations, patient outcomes, and population health analytics, driving better decisions for better care.
Logistics, procurement, and operations analytics that reduce friction and optimize performance end-to-end.
A fast, modern site that books jobs and captures leads around the clock, not just a brochure.
Answer every customer instantly, day or night, and turn after-hours questions into booked work.
Put scheduling, invoicing, and follow-ups on autopilot, so you stop being the bottleneck.
Tools built around how you actually run: portals, dashboards, and integrations that fit.
Book a free Game Plan call: 30 minutes, no pressure, no jargon. We'll show you where the time, leads, and money are leaking, whether it's an AI quick win or a data project.
Book your free Game Plan callPrefer to send details first? Use the form.
Ask about AI, automation & analytics